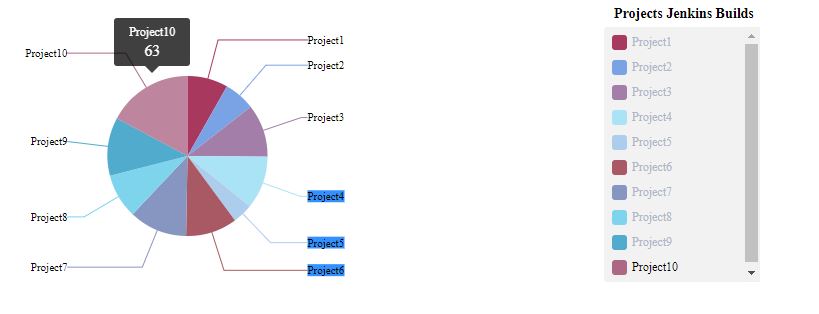
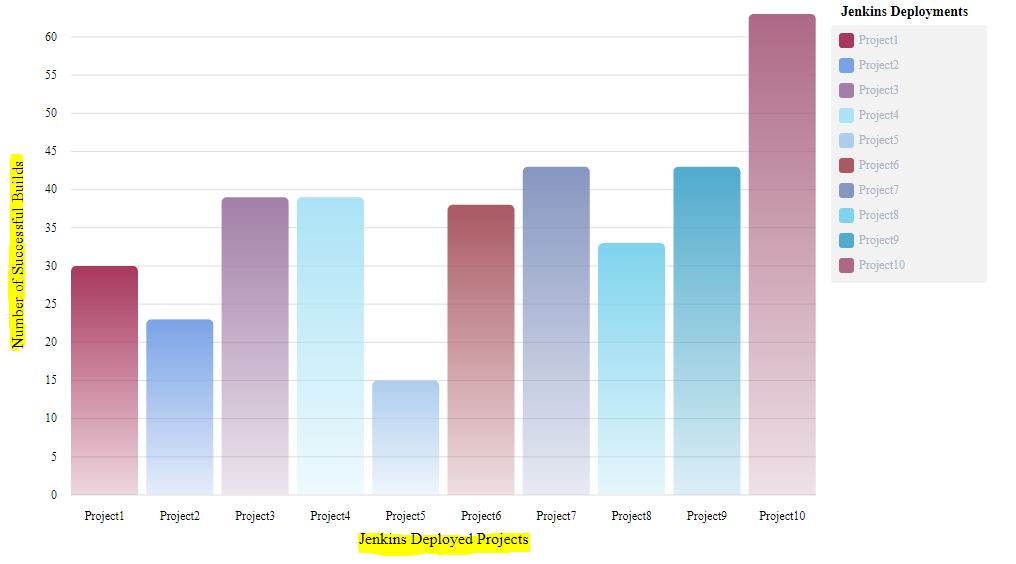
ngx-charts is an open-source, declarative charting framework for Angular projects to build very simplified yet powerful reporting.
Angular will do all rendering and ngx-charts module supports different chart types like bar charts, pie charts, line charts, heatmap, treemap etc, altogether this combo will be useful for any Angular Data visualization projects.
Implementation of ngx-charts:
Step 1: Build an Angular project – refer https://angular.io/cli
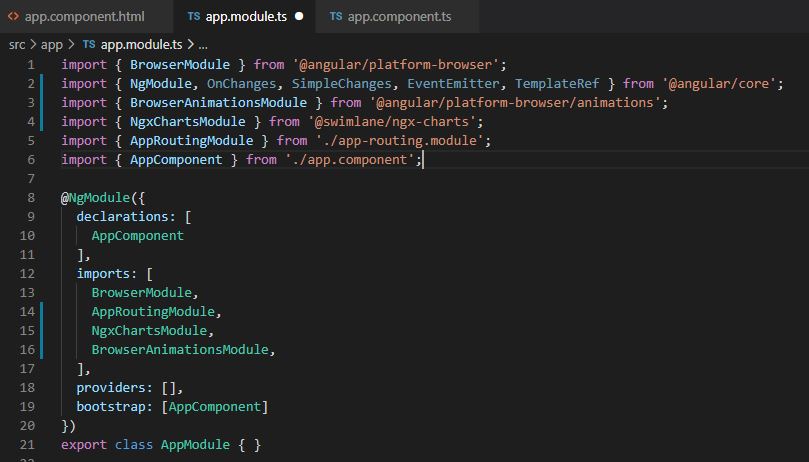
Step 2: refer below screenshot and update app.module.ts
Step 3: refer below screenshot and update app.components.ts
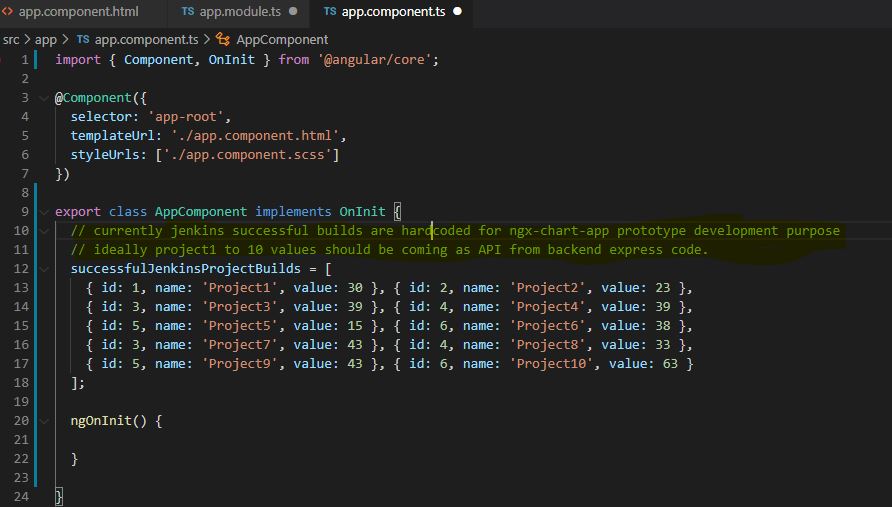
Note: As this project is about ngx-chart implementation, the project build status are are hardcoded in the app.components, however you may have to build express backend code and make api calls to jenkins api to grab the build status and provide to front-end angular when you build a real project.
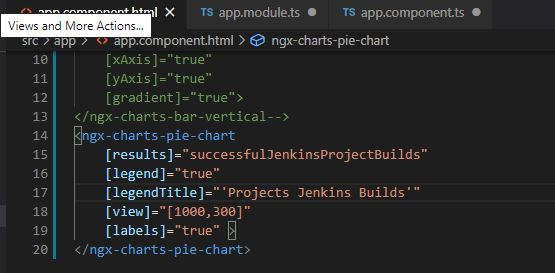
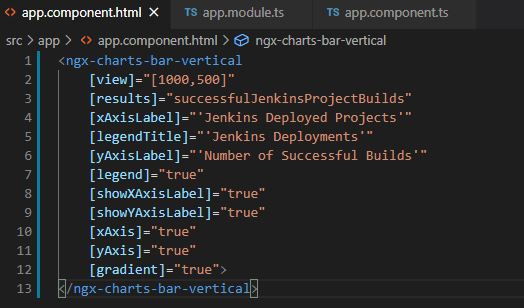
Step 4: refer below screenshot and update app.components.html
For Pie chart
For bar chart
Step 5: run the project using Angular cli “ng server -o”
Refer below pie chart and bar charts from Angular project using ngx-charts module.
